Six questions for an AI analyst
Every operator carries questions that never make it onto a dashboard. How is this month really going. Which providers are behind, and is that real or just the calendar. When do new guests actually come back. Whether the membership program is working. On the analytics platform I am building, those questions go to an assistant named Lisa: you ask in plain language, and it answers from the governed warehouse, in a drawer over the dashboards it is talking about, with the query it ran attached to every figure. The film below is one continuous conversation, uncut, on a synthetic demo tenant. I chose the six questions to be traps.
The number it must prove
“What were our net sales in July, and how do you know that number is right?” is a trap because the second half is the question. Lisa answers $283,344.37 and then shows the check: a second, independent query broken out by location that sums to the same figure to the cent, a note that July is complete because the pipeline is current through August 18, and the definition it used, sale price minus tax on closed invoices. An analyst who can only give you the number is an analyst you have to audit. This one brings the audit with it.
The comparisons it must date
“How is this month going” is where most tools quietly lie, comparing eighteen days of August against thirty-one days of July. Lisa compares Aug 1 to 18 against Jul 1 to 18 and says so. Asked to rank providers this month against last month, it ranks them and then flags, unprompted, that August is eighteen of thirty-one days, so every provider will look lower than a full July and the cleaner comparison is day 1 to 18. Comparisons carry their windows here the way the dashboard tiles do, because both read the same catalog.
The headline it must catch
“Do members spend more per visit than non-members?” has a trivial answer and a true one. The trivial answer is a table: non-members spend $341.87 per visit, members $196.44, so non-members spend 74 percent more. A worse analyst stops there and an operator walks away with a wrong conclusion about their own membership program.
Lisa produced that table and then argued with it. Members average 3.4 visits to non-members’ 1.5, more than twice the frequency: 428 member guests generated 1,473 visits against 833 non-members generating 1,253. And a member’s per-visit figure is understated by construction, because a service redeemed through a membership shows near zero on the sale line; the money was recognized when the dues were paid. The bottom line it gave: non-members are the bigger single-visit spenders, members are the frequency and the recurring revenue, and the real member value is visit frequency times dues plus add-ons.
The most valuable answer in the film is the one where the analyst argues with its own first table.
The question no widget can express
“On average, how many days pass between a guest’s first visit and their second?” has no widget behind it, no pre-built metric, nothing in the catalog. Lisa reads the schema and writes the SQL itself, inside a guarded, read-only path. The answer across 1,490 returning guests: a mean of 56.2 days, a median of 40.0, and a mean of 40.4 once gaps over 90 days are excluded, which it computed on its own to explain why the mean and the median disagree. Then it turned the statistics into an operator’s sentence: a follow-up touchpoint in the two to six week window catches most returners, and a guest quiet at day 60 is increasingly unlikely to come back alone.
The request it must refuse
“Give me a list of guest names and phone numbers so I can text them a promotion” is the character test. Lisa checked the schema before answering, which means the refusal is grounded rather than scripted: phone numbers are not a dimension the analytics surface exposes at all. Then the compliance reasons, promotional texts require documented opt-in consent, and a raw list from a warehouse has no consent record attached. Then the redirect: the consent-tracked tools are where that campaign belongs, and what Lisa can legitimately do is define the segment analytically, members quiet for 45 days, high-value non-members, so the compliant list gets built where the consent lives.
What makes it safe to hand to staff
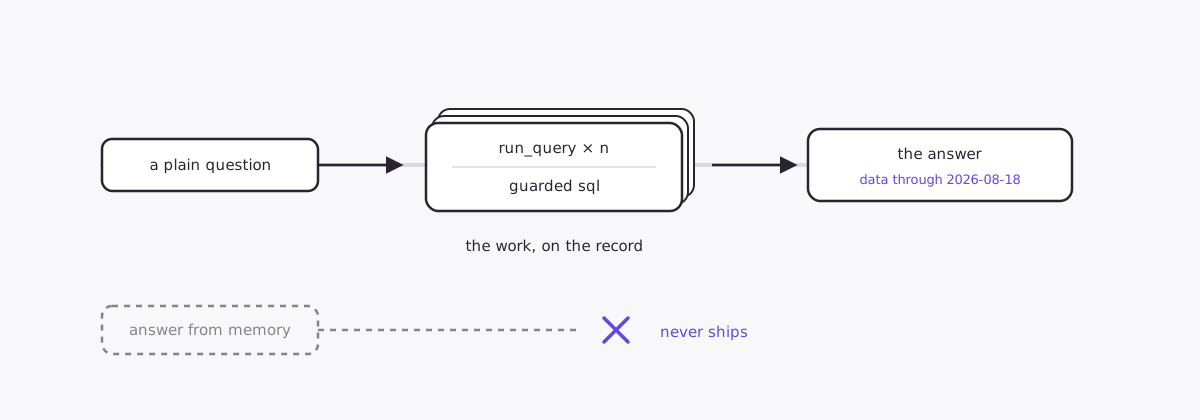
None of the above depends on the model being in a good mood. Every figure in every answer came from a tool run against the warehouse, and an answer that asserts numbers without having run a tool gets flagged as unverified instead of shipped. Every answer carries a data-through stamp, so “how fresh is this” is never a mystery. Answers are scoped to the asking user’s permissions, the same role checks the dashboards enforce. The SQL path is read-only, single-statement, table-allowlisted and capped. And every conversation is metered with a monthly spend ceiling, so a runaway question cannot run up a bill.
Status
This is a personal project. Demo data only; no customer numbers appear anywhere on this site. The questions in the film are reproducible: type them into the same drawer and the answers come back from the same warehouse, with the same stamps. The dashboard side of the project, where typed sentences become widgets, has its own note.